> ## Documentation Index
> Fetch the complete documentation index at: https://help.kuverbooks.com/llms.txt
> Use this file to discover all available pages before exploring further.
# Kuvera Arc Dashboard: Your Business Command Center
> Get a real-time snapshot of your business in Kuvera Arc — monitor stock, sales, purchases, finances, and alerts all from one central dashboard.
The Kuvera Arc dashboard is your central command screen. It gives you a quick view of business activity across stock, pending transactions, sales performance, purchase activity, financial metrics, and alerts without opening each module individually.
## Access the dashboard
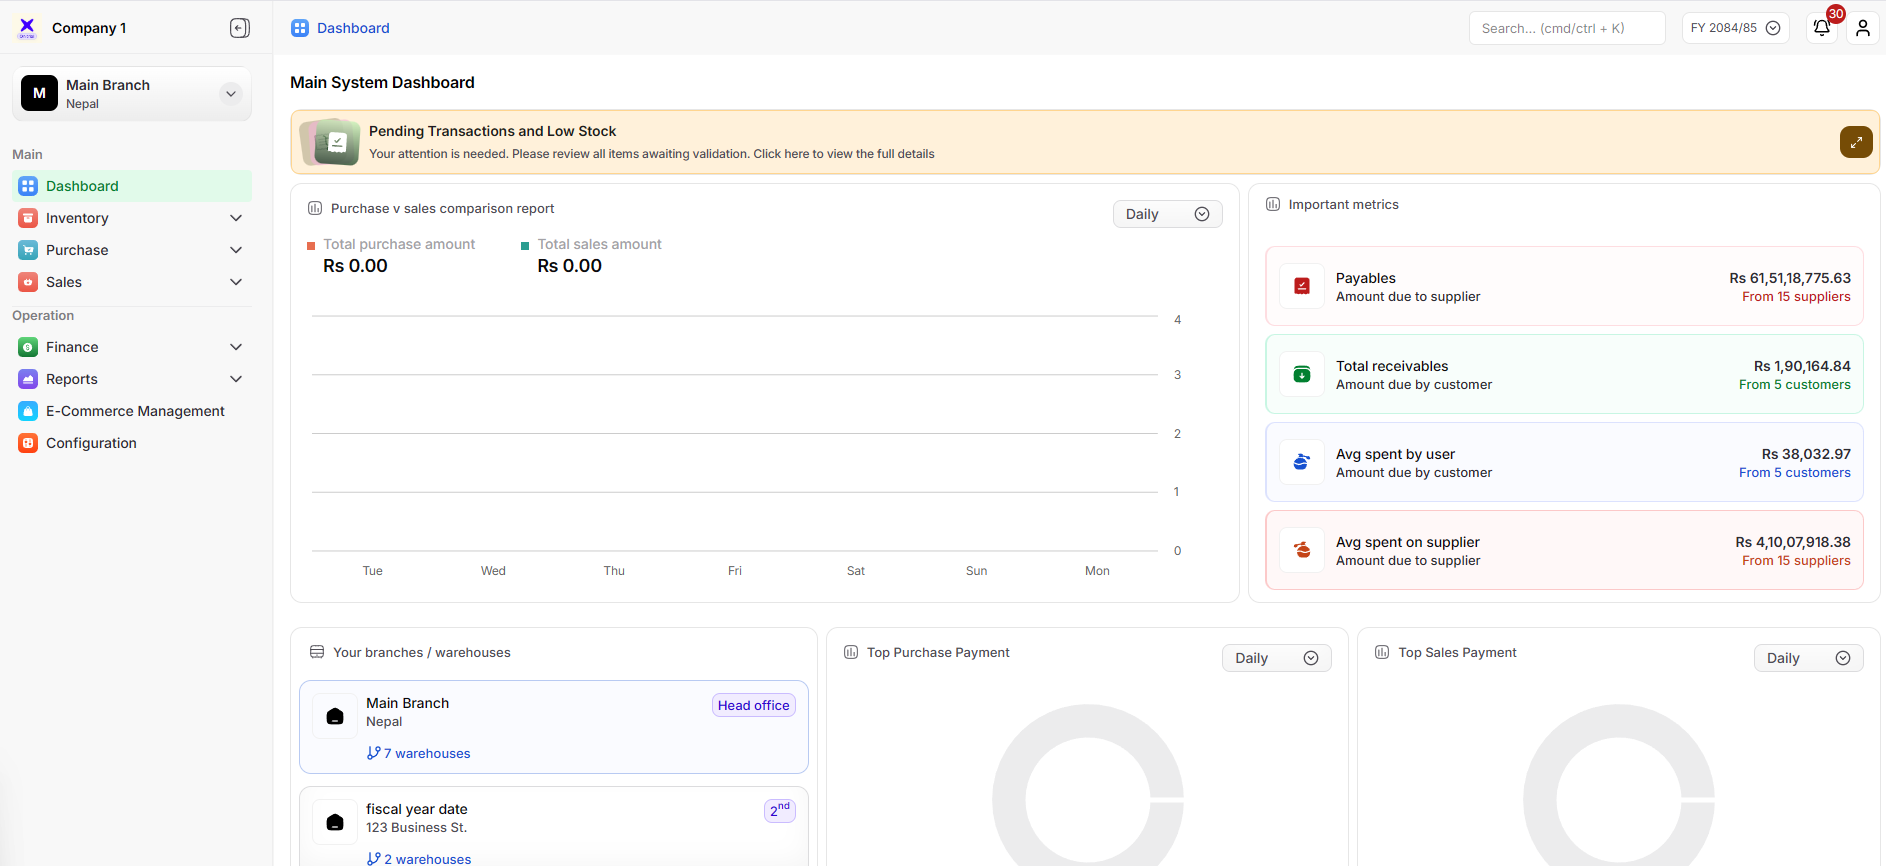 The dashboard loads automatically as the default screen after you log in.
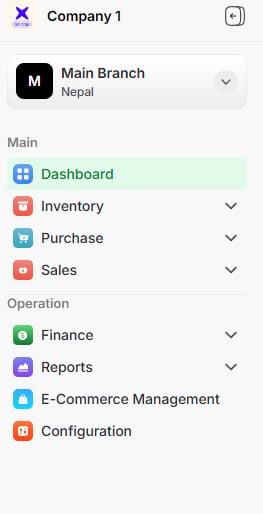
If you have navigated away, click **Dashboard** in the left navigation panel to return at any time.
The dashboard loads automatically as the default screen after you log in.
If you have navigated away, click **Dashboard** in the left navigation panel to return at any time.
 ## Dashboard sections
The dashboard is organized into sections that summarize key areas of business operations.
Review transactions awaiting approval or action, and identify products that are running low in stock.
Compare total purchase spending against total sales revenue over selected time periods.
Monitor payables, receivables, average customer spend, and average supplier spend.
Identify products generating the most sales and purchase activity.
Review business activity across branches and warehouses.
Understand how customers are paying through cash, card, or other methods.
Review summarized financial charts for quick decision-making.
Use the dashboard as your first check-in point at the start of each working day.
## Review alerts and transactions
Use the dashboard to quickly identify items that need attention.
## Dashboard sections
The dashboard is organized into sections that summarize key areas of business operations.
Review transactions awaiting approval or action, and identify products that are running low in stock.
Compare total purchase spending against total sales revenue over selected time periods.
Monitor payables, receivables, average customer spend, and average supplier spend.
Identify products generating the most sales and purchase activity.
Review business activity across branches and warehouses.
Understand how customers are paying through cash, card, or other methods.
Review summarized financial charts for quick decision-making.
Use the dashboard as your first check-in point at the start of each working day.
## Review alerts and transactions
Use the dashboard to quickly identify items that need attention.
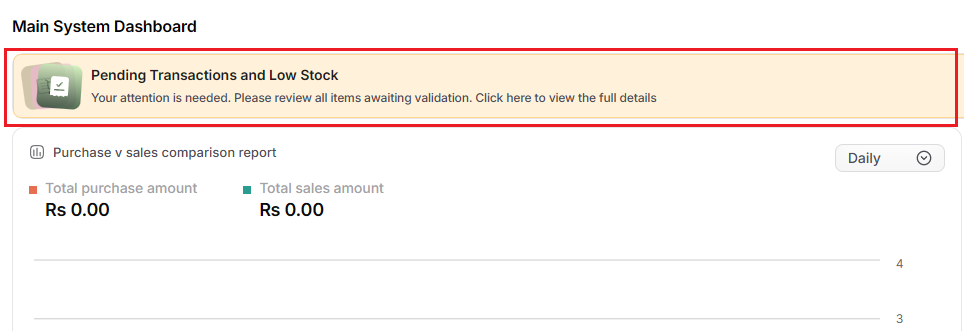 Review transactions that may require approval, confirmation, or follow-up.
Identify products that are running low before they affect sales or fulfillment.
Use the related module to investigate and resolve the issue shown on the dashboard.
## Monitor performance
Use dashboard charts to compare business activity over time.
Review transactions that may require approval, confirmation, or follow-up.
Identify products that are running low before they affect sales or fulfillment.
Use the related module to investigate and resolve the issue shown on the dashboard.
## Monitor performance
Use dashboard charts to compare business activity over time.
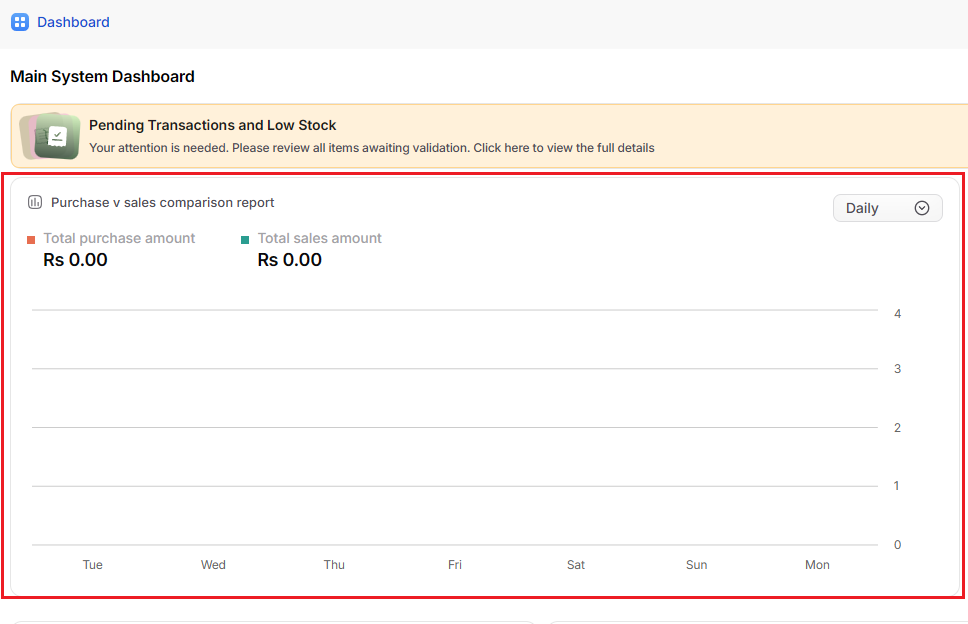 Review sales trends and revenue movement across the selected period.
Review purchase spending and supplier-side activity across the selected period.
Compare sales and purchase values to understand business momentum.
## Track financial metrics
Financial metrics help you understand cash flow and outstanding obligations.
Review sales trends and revenue movement across the selected period.
Review purchase spending and supplier-side activity across the selected period.
Compare sales and purchase values to understand business momentum.
## Track financial metrics
Financial metrics help you understand cash flow and outstanding obligations.
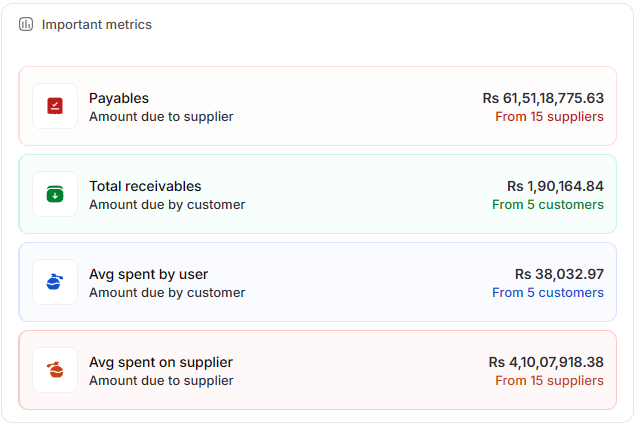 Track amounts your business still needs to pay.
Track amounts your business expects to receive.
Review the average value generated by customer transactions.
Review average spending across supplier purchases.
## Review product and payment insights
Use dashboard summaries to understand product movement and payment trends.
Track amounts your business still needs to pay.
Track amounts your business expects to receive.
Review the average value generated by customer transactions.
Review average spending across supplier purchases.
## Review product and payment insights
Use dashboard summaries to understand product movement and payment trends.
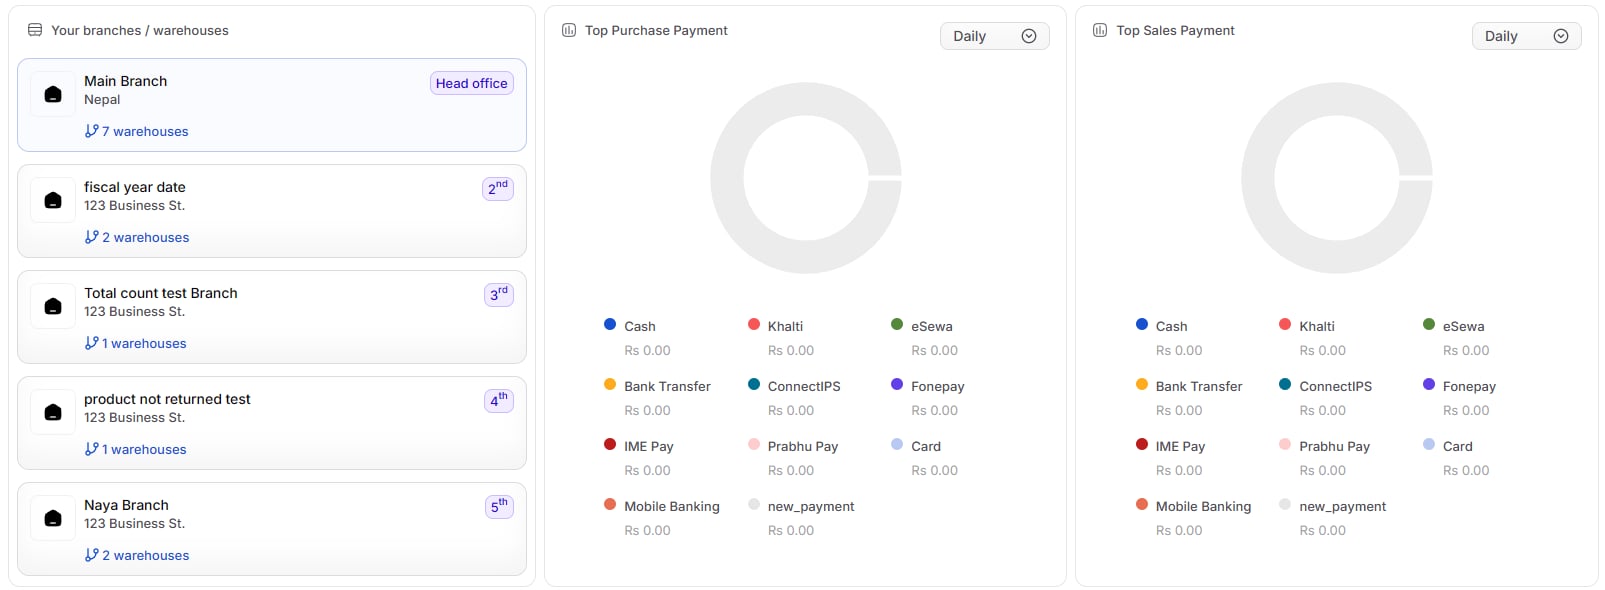 Identify products with the highest sales or purchase activity.
Review how customers are paying across available payment methods.
## How to use the dashboard
The dashboard is mainly a monitoring and navigation tool. Use it to identify what needs attention, then open the relevant module to take action.
Review stock levels, product records, adjustments, and warehouse transfers.
Review orders, invoices, customer accounts, payments, and credit notes.
Review suppliers, purchase orders, goods received notes, bills, and debit notes.
Review bank accounts, payables, receivables, cash flow, and fund transfers.
The dashboard helps you identify what needs attention. Corrections and follow-up actions are completed inside the relevant module.
## Why the dashboard matters
View operational, sales, purchase, stock, and finance summaries from one central page.
Low stock, pending transactions, and unresolved activity can be reviewed before they become larger problems.
Review high-level payables, receivables, and spending trends without opening separate reports.
Use dashboard insights to decide which module or workflow needs attention first.
Review the dashboard regularly. Frequent check-ins help you catch small issues before they affect sales, inventory, or finance.
Identify products with the highest sales or purchase activity.
Review how customers are paying across available payment methods.
## How to use the dashboard
The dashboard is mainly a monitoring and navigation tool. Use it to identify what needs attention, then open the relevant module to take action.
Review stock levels, product records, adjustments, and warehouse transfers.
Review orders, invoices, customer accounts, payments, and credit notes.
Review suppliers, purchase orders, goods received notes, bills, and debit notes.
Review bank accounts, payables, receivables, cash flow, and fund transfers.
The dashboard helps you identify what needs attention. Corrections and follow-up actions are completed inside the relevant module.
## Why the dashboard matters
View operational, sales, purchase, stock, and finance summaries from one central page.
Low stock, pending transactions, and unresolved activity can be reviewed before they become larger problems.
Review high-level payables, receivables, and spending trends without opening separate reports.
Use dashboard insights to decide which module or workflow needs attention first.
Review the dashboard regularly. Frequent check-ins help you catch small issues before they affect sales, inventory, or finance.